Interactive heap-sift demonstration
Algorithm Visualization

- Live
- Check it out!
- Screenshots
- View
Screenshots
Table of Contents
Inception
Motivation
Since university classes I’ve always wondered what it would be like if I didn’t have to learn on the example the teacher had on the slides. I think of edge cases and other scenarios and I want to see how an algorithm behaves in those instances. This has been so far only possible on paper.
Kickoff
Due to a recent burst of algorithm-exposure (interview preparation) I went through the same things again, so I decided to try out what I can do.
Goals
- show the code of the algorithm
- show the raw data structure
- show the abstract data structure
- describe the algorithm steps as the teacher would
- visualize the connections between all these
Future plans
- Better representation of memory (stack frames/variables/heap)
- Stepping backwards
- More visualizers (2D grid for DP/path finding, arbitrary trees, graphs, BIT from TopCoder, histogram)
- Pseudo-code parser to build AST
- Object/struct support
- More languages
- Lots of examples and ability to submit more
Implementation
I decided to try this out on the sift-down algorithm applied to binary heaps to restore the heap property: parent is always greater than or equal to both children
. During implementation I tried to plan ahead to see how other structures algorithms would behave and tried to generalize.
Architecture
There are multiple layers in play here:
- the algorithm (abstract steps)
- the implementation of the algorithm
- the execution of the algorithm on some input
- the runtime memory of an execution
- the abstract data structures represented by those bytes in memory
Abstract code
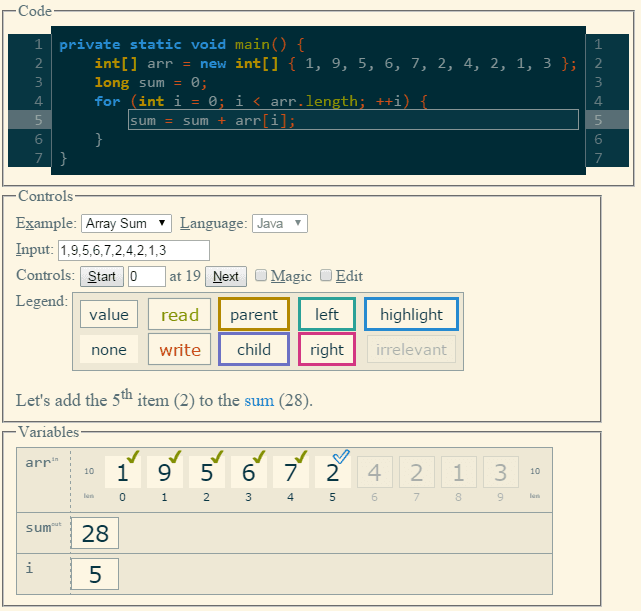
The first iteration combines the algorithm description and the implementation into one step. I implemented an AST-like structure that contains code elements (control blocks, statements and expressions and some magic statements). The magic statements provide the textual representation and they provide link to the other layers. They know which parts of the in-memory data is relevant to the step that is currently executing (they know where the execution is because they’re statements) and they’re highlighting those. Currently only the necessary parts are implemented that can represent the sift-down algorithm. Currently there’s no parser or language available, only hand-created AST’s are in play.
Displayed code
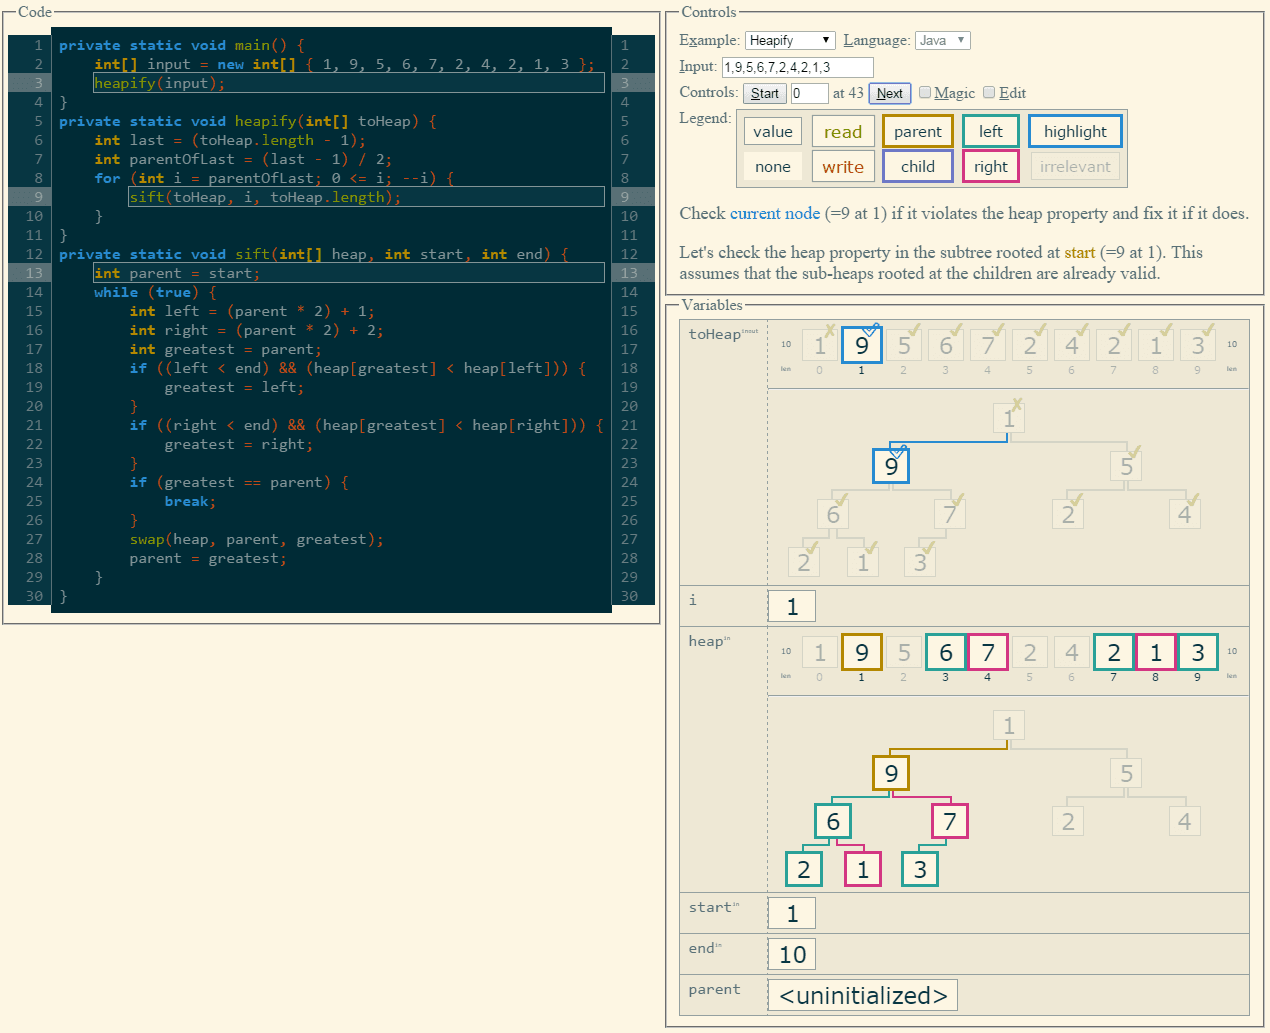
The next layer is transformation on the AST to generate some nicely formatted and syntax highlighted Java code as HTML so the user can interact with it. Currently only a Java-like syntax is possible, but I have plans to extend it to multiple languages if possible. The current line and expression is highlighted when stepping through the code.
Execution
I implemented a stepper which knows where the execution is and can determine which code element comes next when the algorithm is executed on the input, it is essentially interpreting the AST. It was important that the algorithm only advances a little bit at the time so the user can investigate each part and how they work. The stepper handles scoping of the variables as well, it fires events when they come into and go out of scope, so the visuals can update accordingly.
Visual Data
Each variable has a view that manages the basics, like scoping and provide a container. Each view can contain one or more visualizations that represent the same data and can cross-reference each other. Every user interaction with a view is reflected on all the visualizations so the user can see how they represent the same data. The binary heap is a good example here, because it is a tricky structure with an array representing a tree with some math determining parent–child relationships.
Step Descriptions
As mentioned above there are magic statements which display some description of the current step. These descriptions link to the visuals and provide feedback on user interaction. This way hovering part of the description can highlight part of the data that it speaks about to provide even more linking between description and actual data, a simple example is when talking about the first element of an array it would highlight the 0th index.


