Open a window to your build, literally.
Gradle Visualization
This project is not publicly released, yet. The source code is available, so it can be built manually. Feel free to nag me if you’re interested.

- Sources Code
- Look at sources
- Screenshots
- View
Screenshots
Videos
Table of Contents
Inception
Many years ago I wanted to learn more about how the Android Gradle Plugin wired up internal tasks. I was also curious about how the task graph looks like, so I started to write a plugin that visualizes the task graph.
Implementation
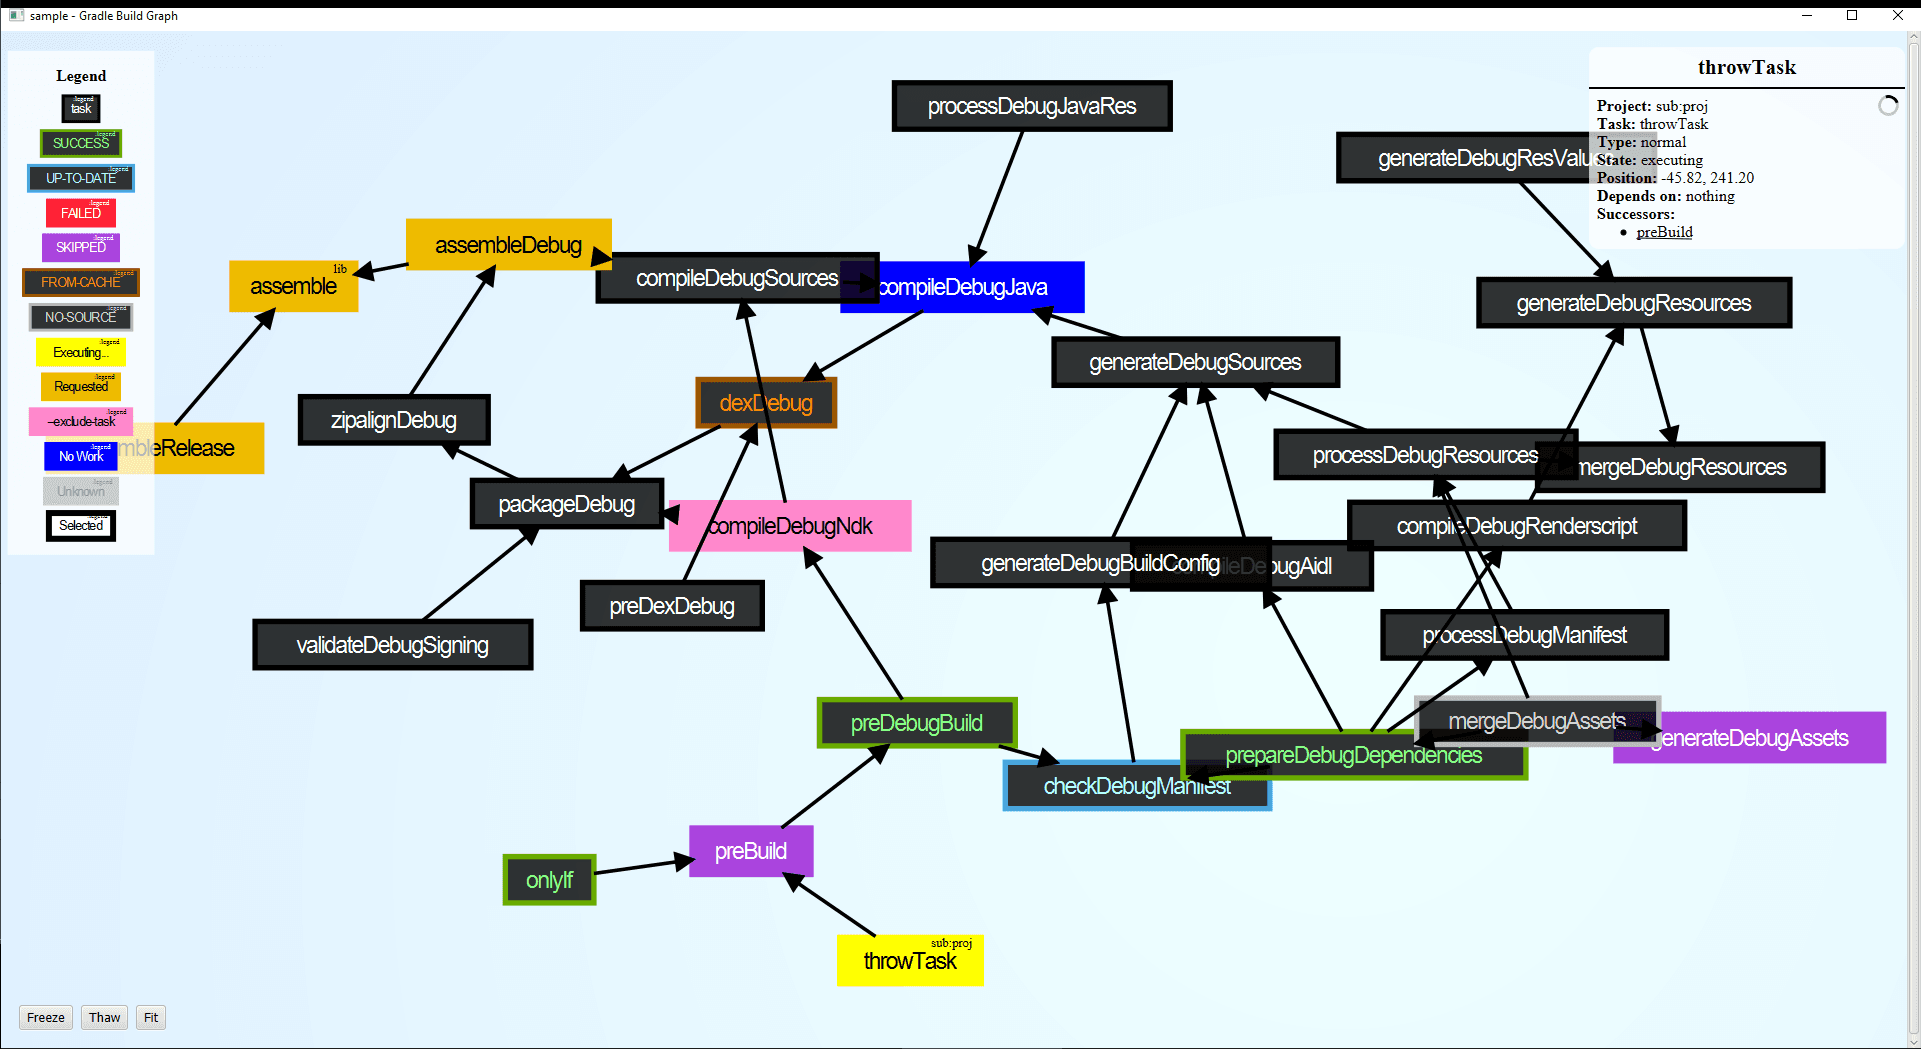
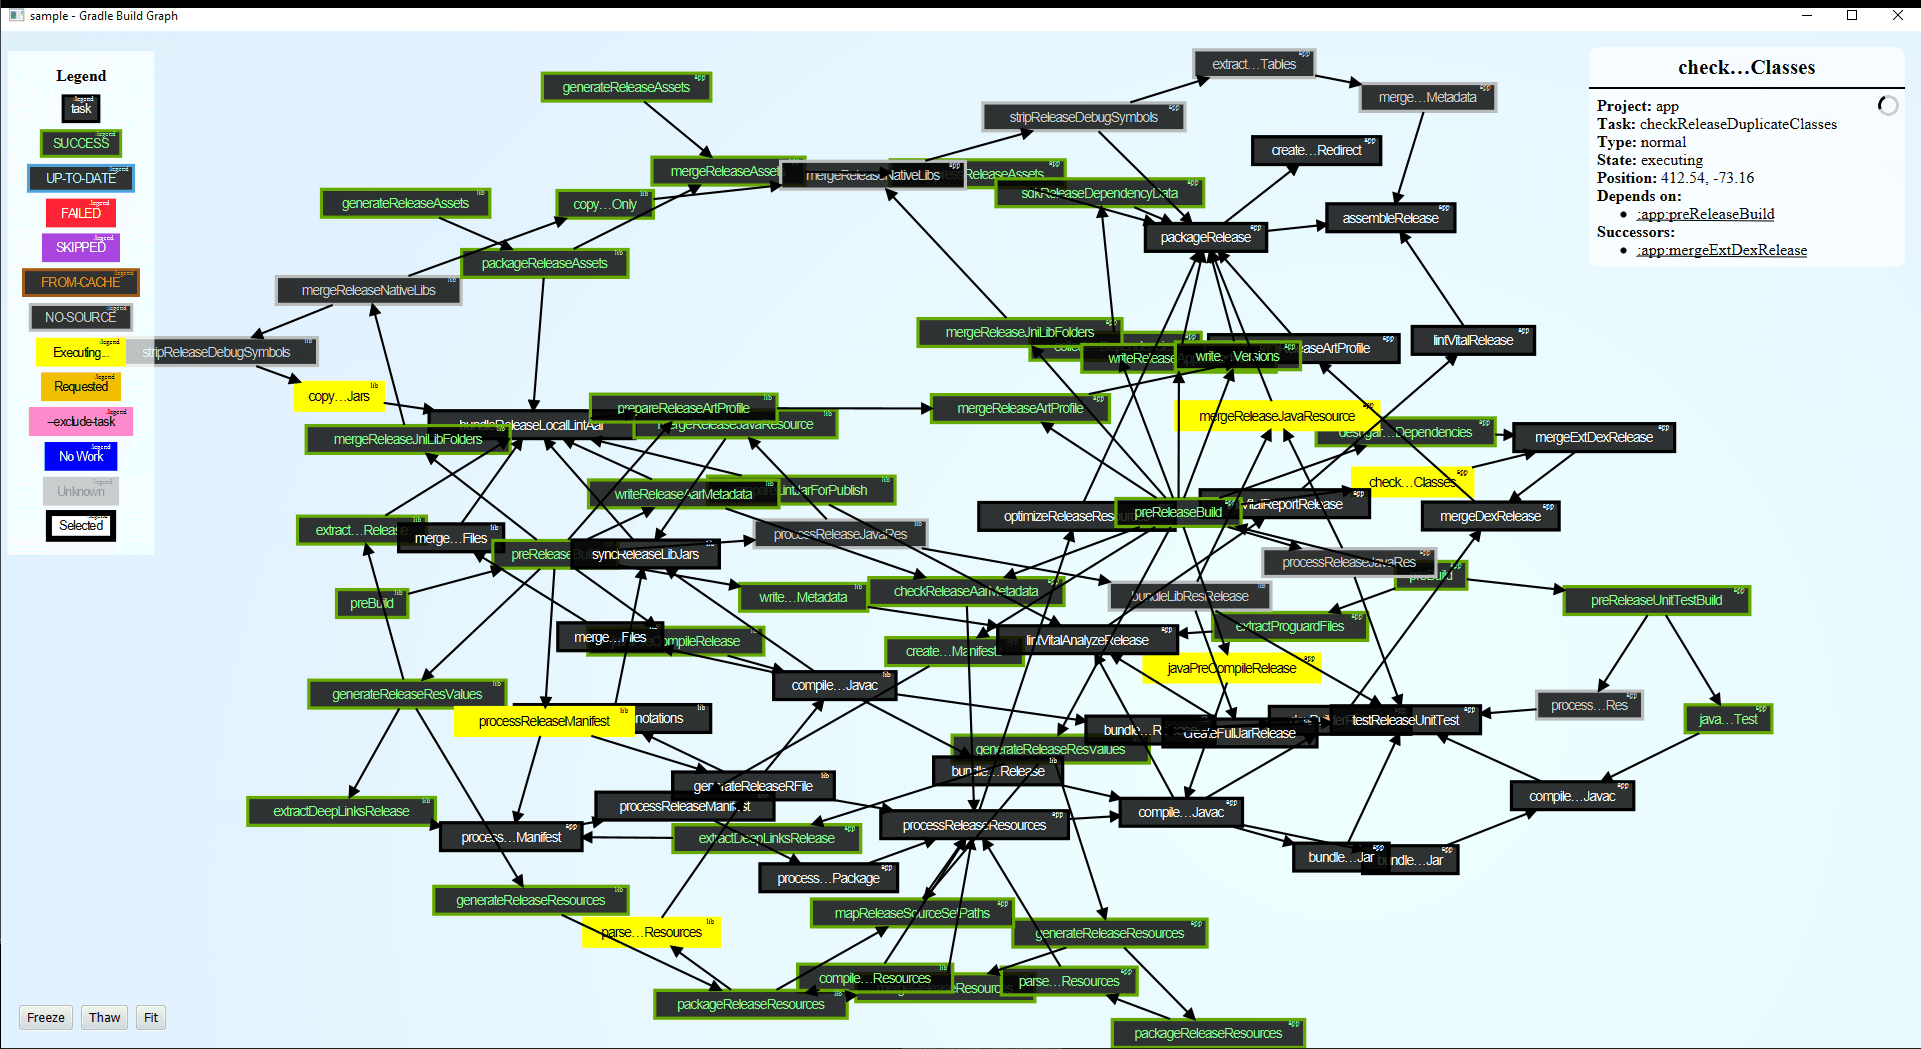
Originally I used Gradle 2.x public APIs to gather enough information about the dependencies. This is simple enough. Interestingly Gradle runs on Java, which means we can open UI windows. I used JavaFX to create a simple UI that shows the task graph and allows to interact with it. But I didn’t want to too deeply tie myself to any UI framework, and wanted fast iterations. In the end I used an embedded browser to display a D3.js visualization.
History
Not yet released, but can be built from source.

